Water Quality Module
Summary
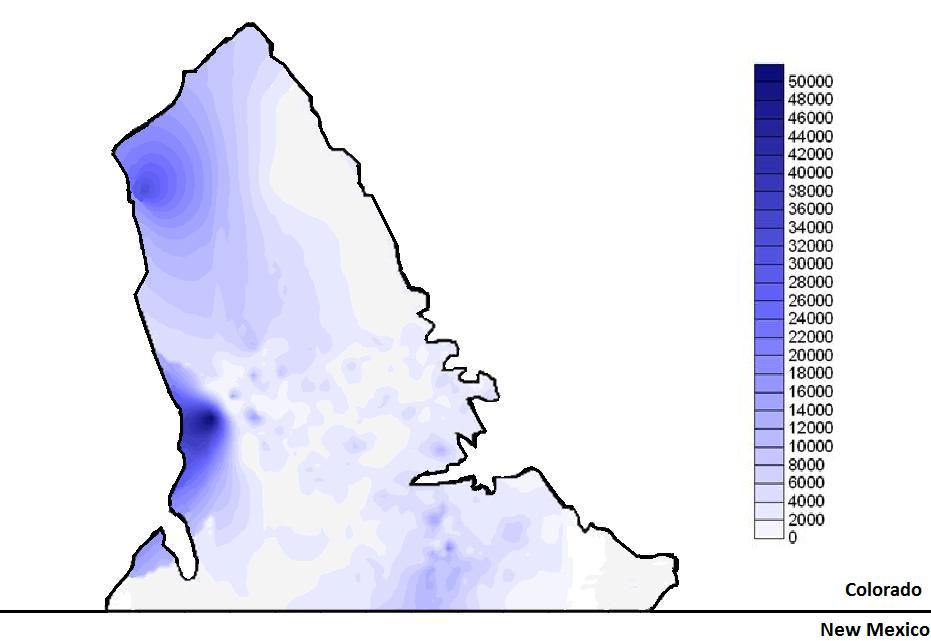
The Water Quality Module (WQM) provides comprehensive produced water quality data for coalbed methane production wells. To predict the water quality of wells based on location, the module incorporates known water quality information from a combination of public and private sources. Data are currently available for three major producing basins in the Rocky Mountain Region, including the Powder River, Raton, and San Juan basins.
User Input and Outputs
The module is amenable to a broad range of user inputs, from limitation (location and basin of interest) to substantial (validation of user observed constituent concentrations). The WQM is capable of estimating produced water quality based on different levels of data available to the user.
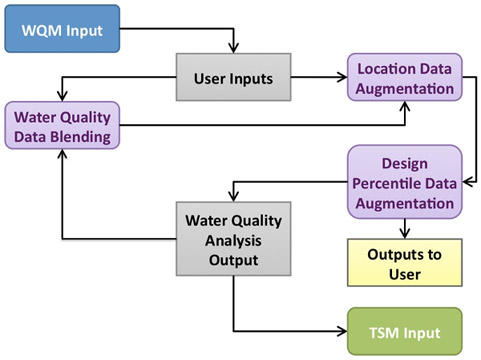
WQM Flowchart
Mode 1: User is interested party without produced water quality information
Required User Inputs: General location information including the basin, the state, target coal formation, and design percentile to control the conservativeness of constituent estimation
Expected Outputs:
- Comprehensive list of water quality values expected for specified location
- Location specific statistics, charts, and area map
- Estimation of a complete produced water quality chemistry specific to the location
- Printable output file
Mode 2: User is interested party with limited or incomplete produced water quality information
Required User Inputs: General location information including the basin, the state, target coal formation, units of flow rate used for produced water, and design percentile to control the conservativeness of constituent estimation
Expanded Capabilities:
- User is able to input up to 200 wells with average flow rates and water quality data in spreadsheet database
- User can define "Single Well", "All" or a group of wells to produce a blended water quality representing the selection
- The WQM highlights user data enter that is outside the range of expected values of the specific location
- User can choose to accept the WQM estimates or keep their entered values for the output file
- Data lacking input from the user are automatically augmented with data from the WQM representing the design percentile chosen for conservativeness
Expected Outputs:
- Comprehensive list of water quality values expected for specified location
- Location specific statistics, charts, and area map
- Estimation of a complete produced water quality chemistry specific to the location
- Data reference information "User" or "WQM" for source of data inclusion
- Printable output file
Mode 3: User is interested party with complete produced water quality information
Required User Inputs: General location information including the basin, the state, target coal formation, units of flow rate used for produced water, and design percentile to control the conservativeness of constituent estimation
Expanded Capabilities:
- User is able to input up to 200 wells with average flow rates and water quality data in spreadsheet database
- User can define "Single Well", "All" or a group of wells to produce a blended water quality representing the selection
- The WQM highlights user data entry that is outside the range of expected values of the specific location
- User can choose to accept the WQM estimates or keep their entered values for the output file
Expected Outputs:
- Comprehensive list of water quality values expected for specified location
- Location specific statistics, charts, and area map
- Estimation of a complete produced water quality chemistry specific to the location
- Data reference information "User" or "WQM" for source of data inclusion
- Printable output file
Users specify their design conservativeness by requesting data that range from the 50th to 95th percentile statistically in the basin. Blending tool allows users to save well water quality inputs and blend flows from different wells together to design treatment for a blended water quality.
Analysis – Water Quality Database
The WQM pulls known water quality information from a combination of public and private sources. The following constituents are included in the database:
| Alkalinity (as CaCO3) |
| Alkalinity-Bicarbonate |
| Alkalinity-Carbonate |
| Aluminum |
| Arsenic |
| Barium |
| Benzene |
| Boron |
| Bromide |
| Calcium |
| Chloride |
| Chromium |
| Conductivity |
| Copper |
| Cyanide, free |
| Ethylbenzene |
| Fluoride |
| Iron |
| Lead |
| Lithium |
| Magnesium |
| Manganese |
| Nickel |
| Oil and Grease |
| o-Phosphate |
| pH |
| Potassium |
| Radioactivity, Gross Alpha |
| Radioactivity, Gross Beta |
| Radium-226 + Radium-228 |
| Radon 222 |
| Sodium Adsorption Ratio (SAR) |
| Selenium |
| Silica (SiO2) |
| Silver |
| Sodium |
| Strontium |
| Sulfate |
| Temperature |
| Toluene |
| Total Dissolved Solids (TDS) |
| Total Nitrogen (as N) |
| Total Organic Carbon (TOC) |
| Total Suspended Solids (TSS) |
| Uranium |
| Xylenes (total) |
| Zinc |
Output
The output screen provides users a consolidated page with all general user provided data, reference to the outcome of their database survey, and results of their private data augmentation. After reviewing the output information, the user can send water quality and quantity data to the Treatment Selection Module (TSM) or can dictate concentrations of constituents to be output for use in the TSM.
Support information for this module includes:
- CBM Produced Water Quality Document: Comprehensive constituent data, statistics, graphs and maps for major ions present in coal bed methane produced water chemistry
- User Manual
How does this module relate to other modules in the tool?
TSM – The WQM provides a complete list and estimation of concentrations of constituents occurring in produced water in CBM production wells. User data from production wells is blended, validated, and augmented, with a user specifically defined level of conservativeness. The WQM provides a comprehensive list of water quality parameter estimations for input into the TSM. It is recommended that users proceed through this module first in order to acquire a full understanding of water quality to properly design a water treatment process.
BSM – The data delivered to the BSM includes the best ranked treatment train for each beneficial use, and the capital cost and energy and chemical demand for these treatment trains.
BEM – The WQM provides inputs for the TSM but does not directly interact with the Beneficial Use Economic Module (BEM).
For more information, please refer to the User Manual.